Reading your website analytics
Visits, popular pages, where people came from and which towns they're in — without the spying.
Open this in your portal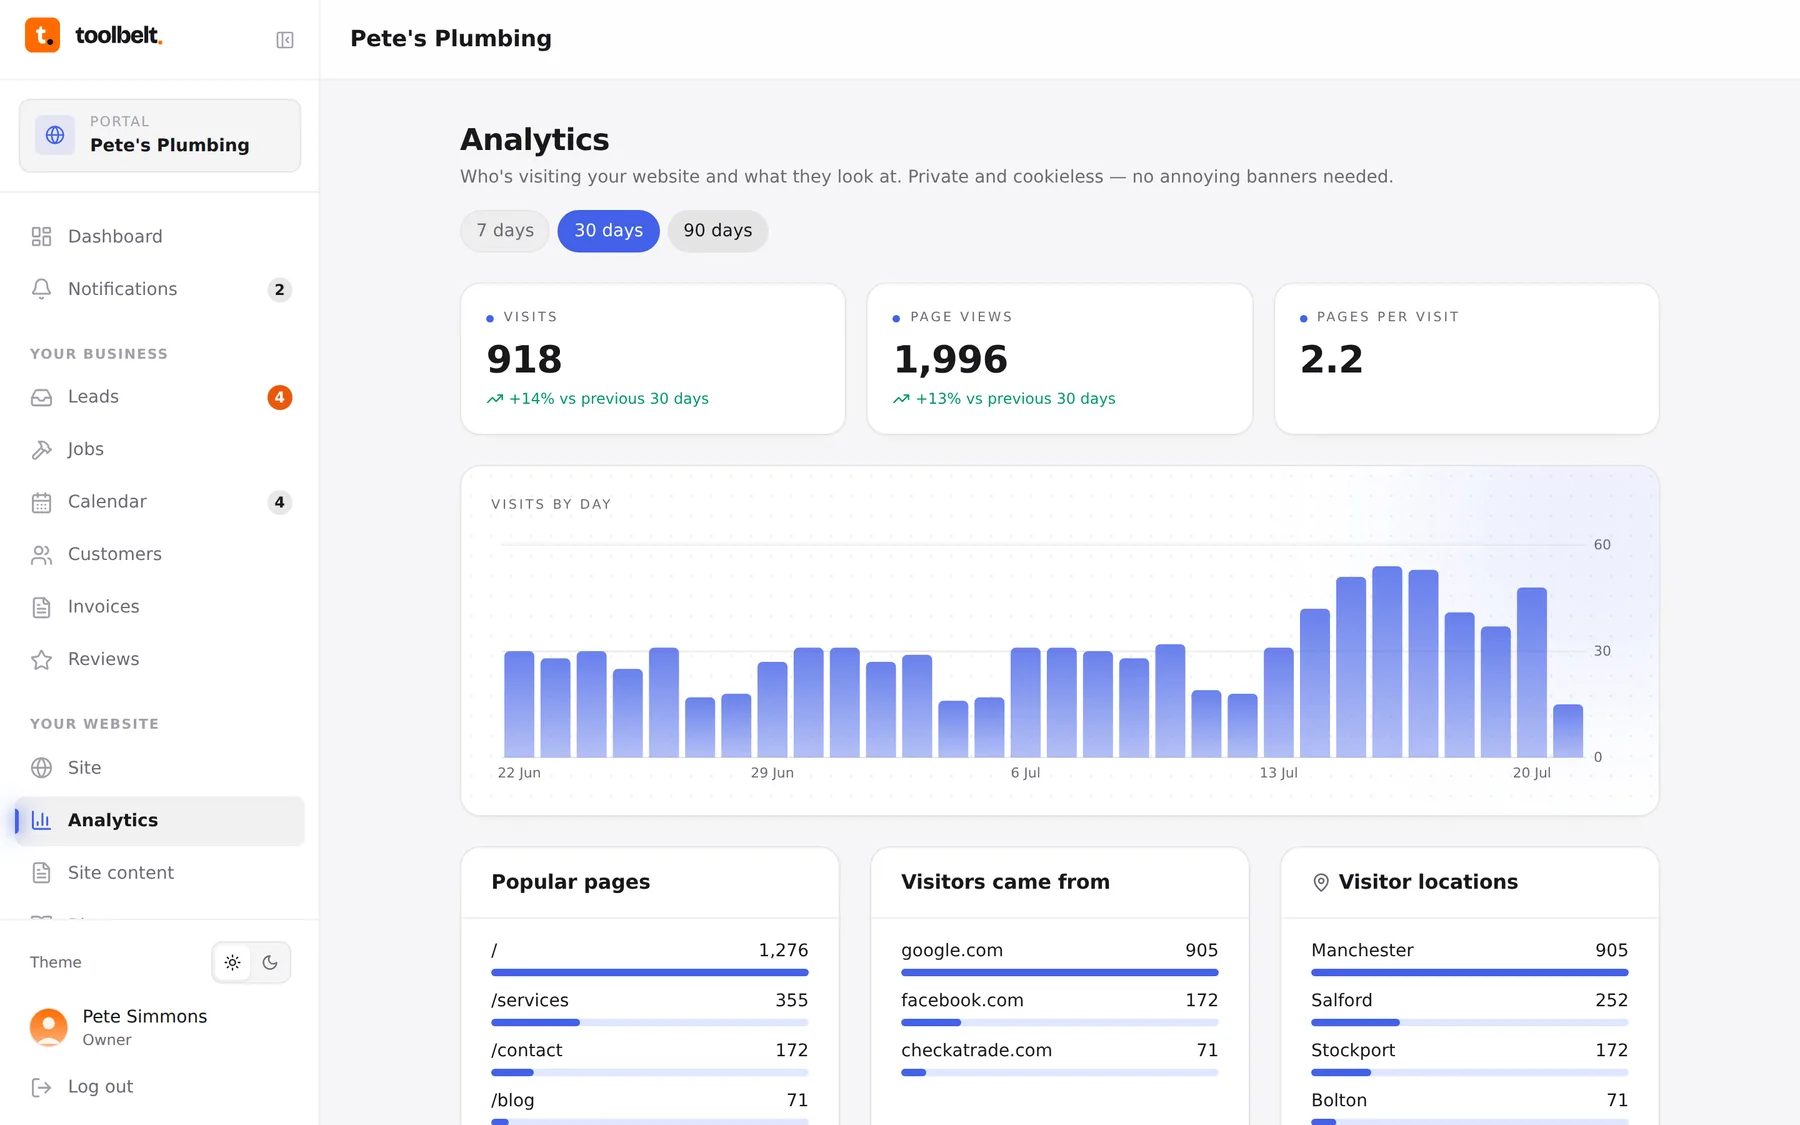
Analytics shows who’s finding your website — privately measured, no creepy tracking, no cookie banner nonsense. The dashboard gives you the week; this page gives you the story.
What to look at
- The visits chart — switch between 7, 30 and 90 days. The trend matters more than any single day; you’re looking for the slow climb.
- Top pages — what people actually read. If a blog post is in there, write more like it.
- Referrers — where visitors came from: Google, Facebook, Checkatrade. This is your marketing receipt — it shows what’s working.
- Cities — roughly where your visitors are. If a town you’d love more work in is missing, that’s a hint for your next post or service page.
What “good” looks like
Steady beats spiky. A local trade site that grows a little month on month is doing its job — the visits chart on your dashboard shows the week-on-week change so you don’t have to squint.
Tip: check monthly, not daily. Daily numbers wobble; monthly numbers tell the truth.